
S.M.A.R.T. is a monitoring system built in computer hard disk drives (HDD), solid-state drives (SSDs), and eMMC drives. S.M.A.R.T. is an abbreviation for Self-Monitoring, Analysis and Reporting Technology, and sometimes you can see it written simply as SMART. This system’s main function is monitoring the drive’s processes while constantly anticipating an imminent hardware failure. When it does detect a possibility of such a failure, a software integrated with it can warn a user of the host system of potential data loss and help them take action before data goes missing.
Without a proper integration with a software that can read and process S.M.A.R.T. data, the gathered information is useless. This is where Disk Drill comes in. As one of our completely free data protection features, we offer S.M.A.R.T. Monitoring.
With S.M.A.R.T. Monitoring turned on, Disk Drill will alert you if any problem is found with your drive that indicates it might fail in the near future. These alerts can help you take action and backup your data before you run into drive failure problems. As we all know, there are many variables that impact file recovery chances, so why not take every opportunity to prevent data loss before it happens? Below are some frequently asked questions about S.M.A.R.T. Monitoring.
S.M.A.R.T. Monitoring Setup
How do I Turn S.M.A.R.T. Monitoring ON?
By default, Disk Drill does not monitor your drives for hardware issues. This option should be turned on manually. Whenever you decide you are ready to turn S.M.A.R.T. monitoring on, simply open Disk Drill, in the “Extra tools” panel on the left go to “S.M.A.R.T. monitoring”. Read about this method and watch the introductory video to know more about it. When ready, click “OK, let’s do it” and turn S.M.A.R.T. on with a button at the top of the app window. You’ll then be able to customize additional settings for the monitored drive.


How do I Turn S.M.A.R.T. Monitoring OFF?
That’s actually as easy as a pie! Simply open the Disk Drill app, go to the “Extra tools” panel on the left and select “S.M.A.R.T. monitoring”. A panel will appear next to the Extra tools that will show the status of S.M.A.R.T. monitoring as ON with the “Turn off” button right there.


How do I Turn S.M.A.R.T. Monitoring ON for External Devices in macOS?
You may have noticed that in Disk Drill S.M.A.R.T. Monitoring is only activated for your Mac’s internal hard drive by default. There is a way, however, for you to monitor the status of your external drives as well. It involves downloading a free third-party app called SAT SMART Driver.
- Since SAT SMART Driver is a third-party app, CleverFiles takes no responsibility for its performance. But it’s a nice way to monitor all of your drives if you wish to give it a try.
- Starting with macOS 11 (Big Sur), SAT SMART Driver is not recommended for general use for lack of updates and support from its authors.
- S.M.A.R.T. Monitoring is not available for USB flash drives. As for other external devices, make sure to check whether your external drive enclosure supports the SAT (SCSI ATA Translation) required by this tool. You can do so here.
- Power-cycle your external drive by disconnecting it from your Mac and unplugging it, if it has a power adapter.
- Download SAT SMART Driver:
- Once you have the ZIP file downloaded to your computer, double-click on it to unzip. Open the resulting folder.
- Double-click on the package (.pkg) file with the box icon and follow the installation steps.
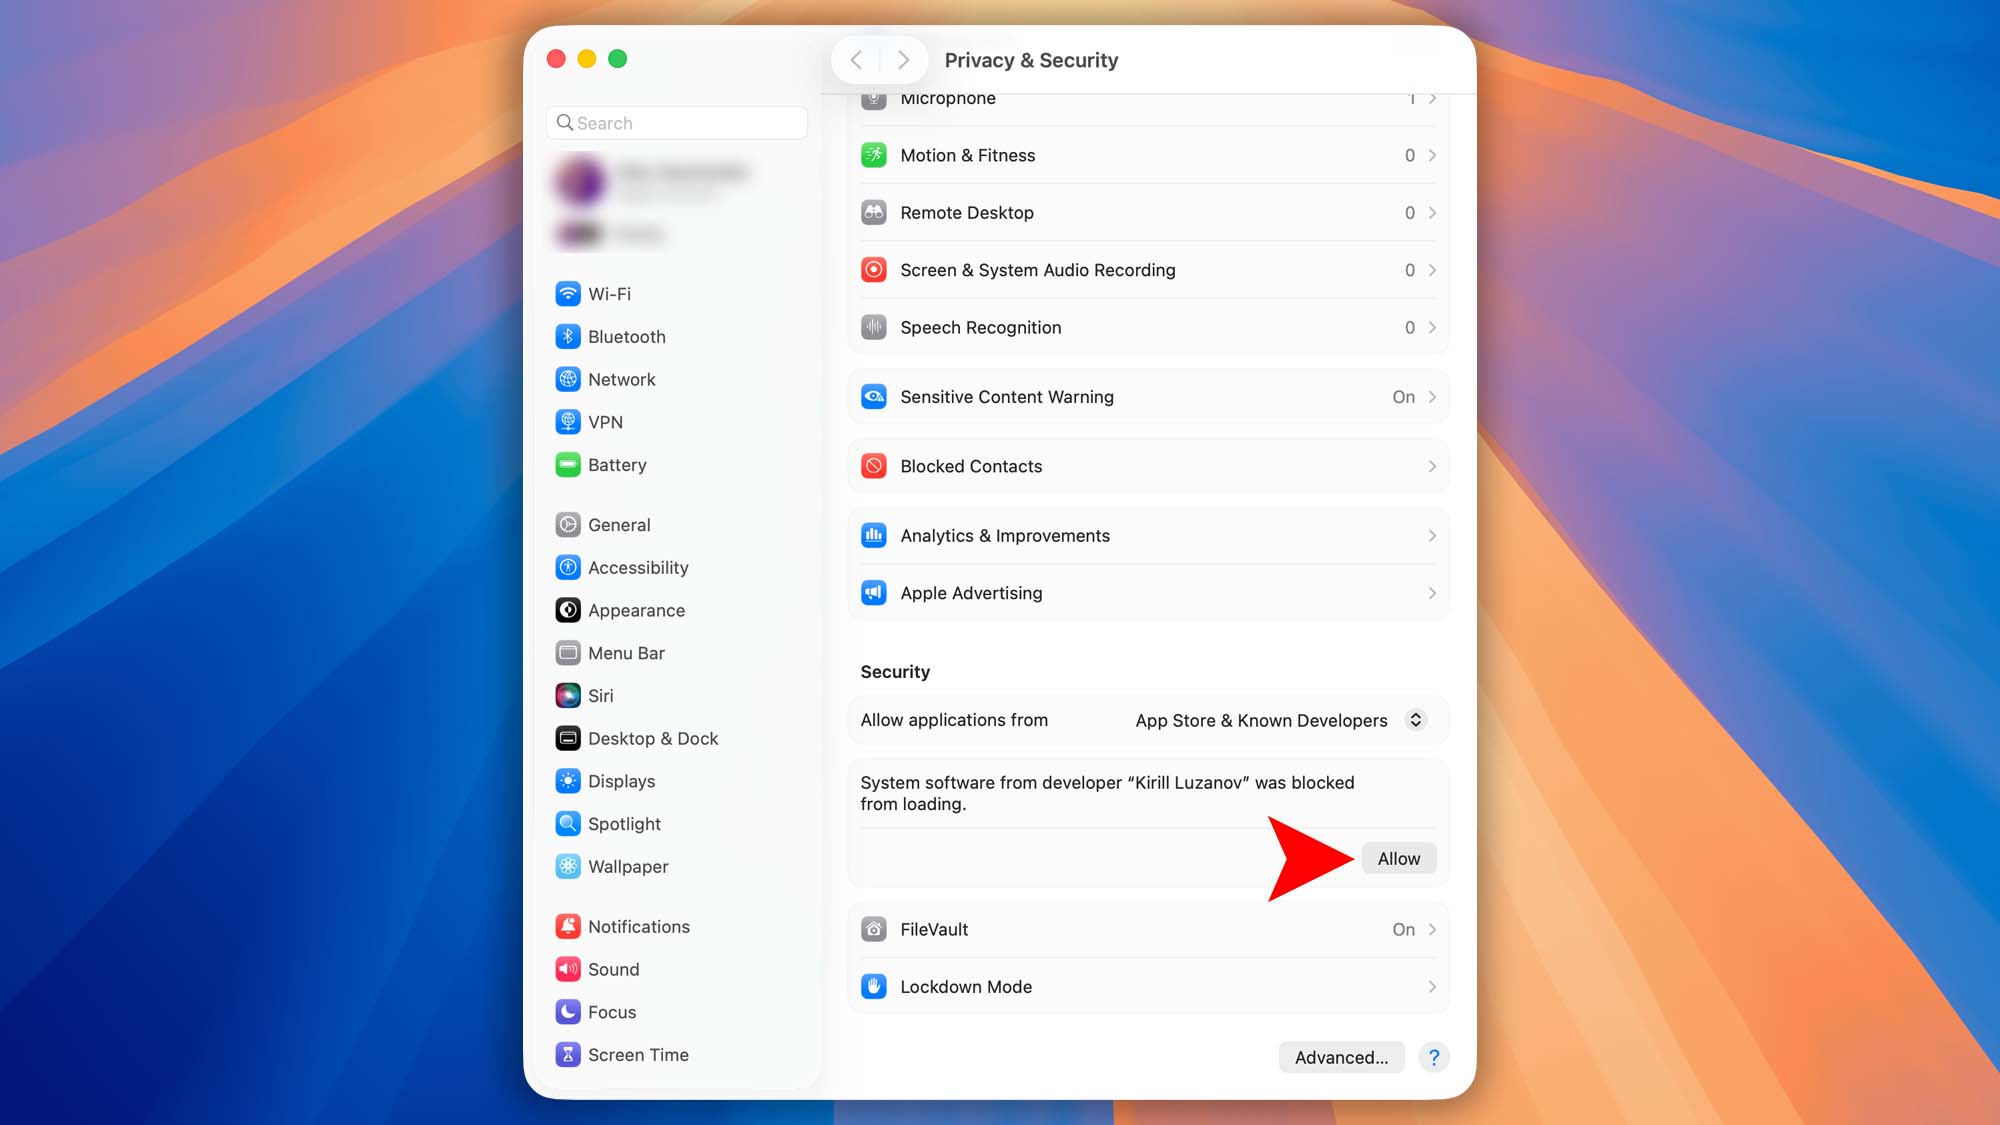 💡 10.13 – 11.0 users will need to allow the deployment of the new kernel extension (driver) in their System Preferences.
 - Reboot your Mac.
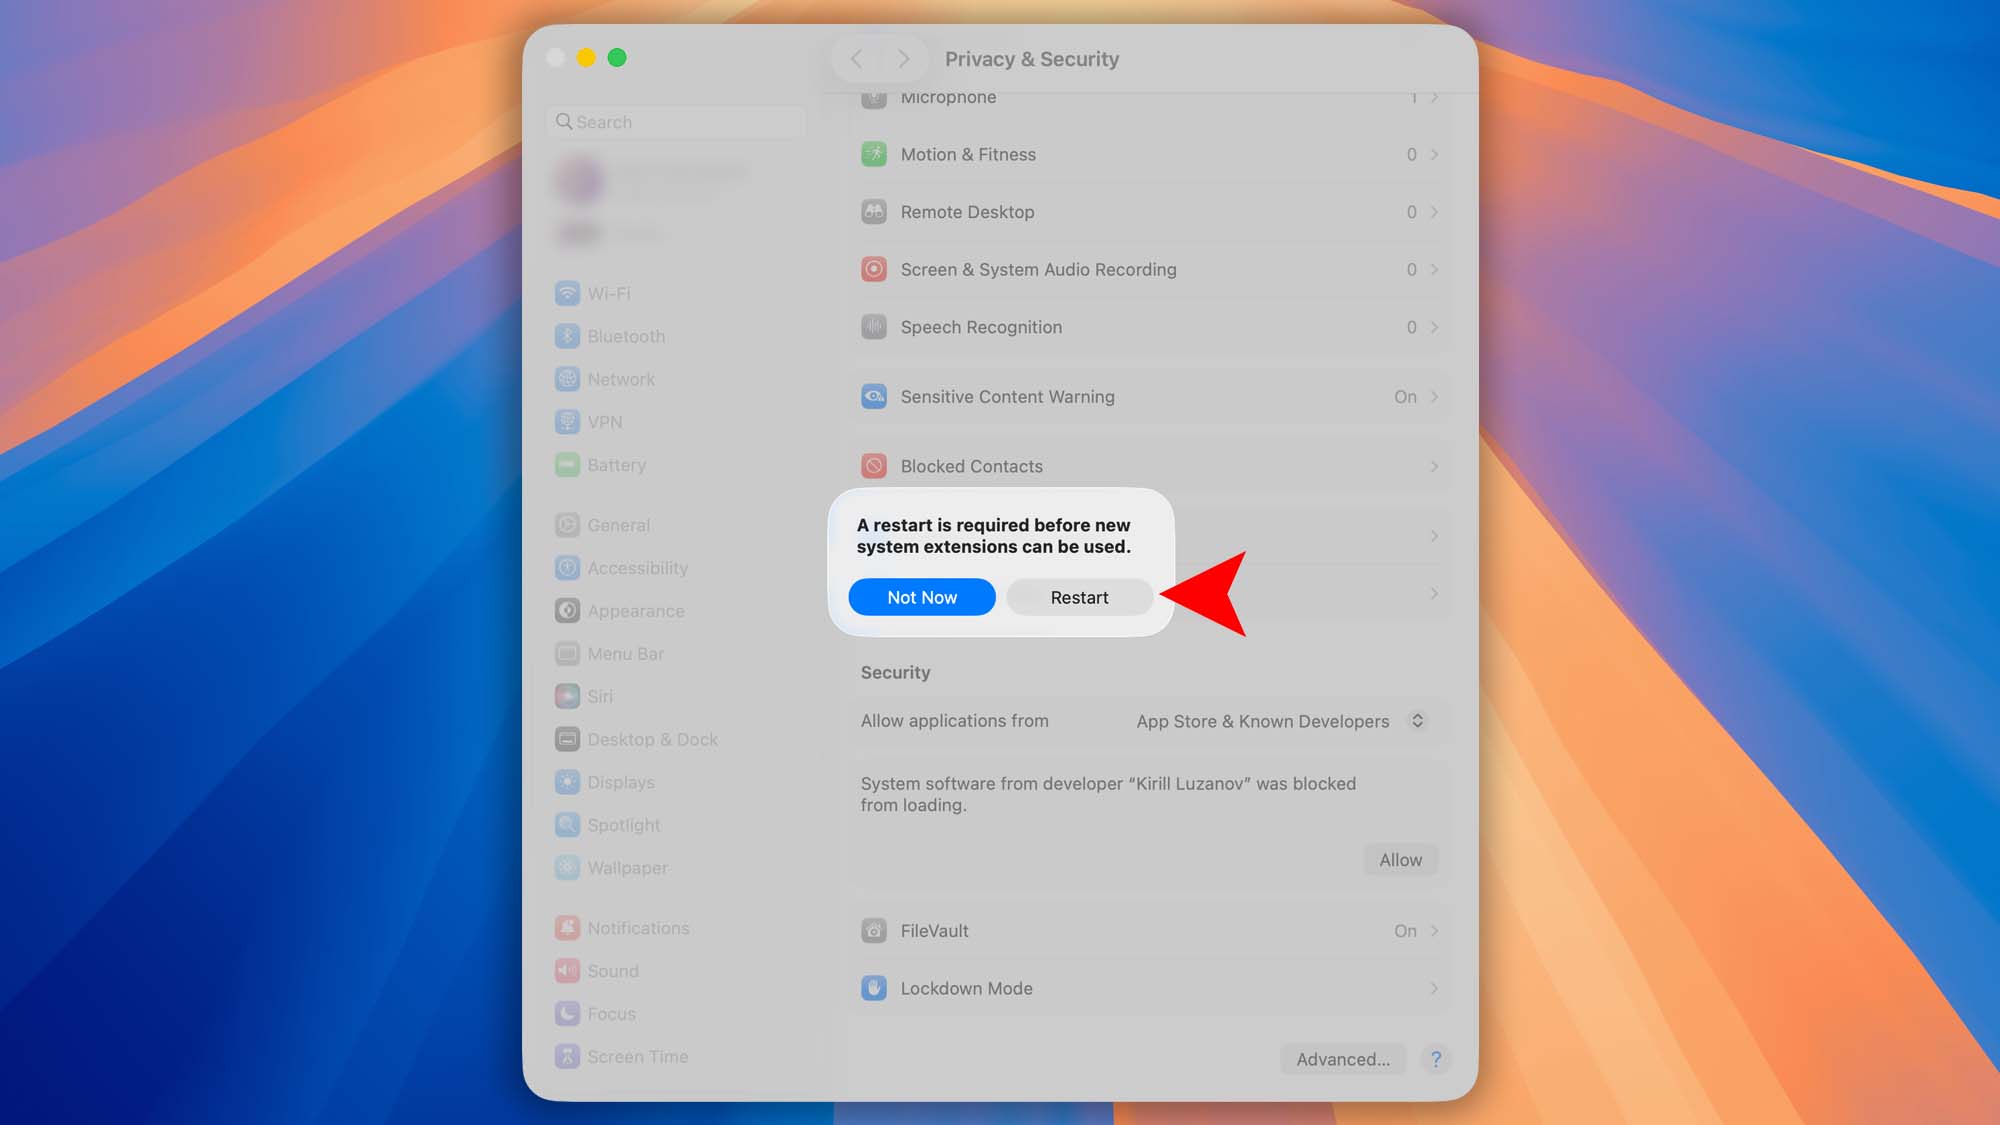
- Reconnect external drives.
- Launch Disk Drill. The S.M.A.R.T. status should now be listed for your external drive.

If you have a Mac powered by Apple silicon, you’ll first need to allow the installation of kernel extensions on your Mac. To do so, follow the steps below:
- Restart your Mac in Recovery Mode:
➡️ Turn off your Mac
➡️ Turn it back on and don’t let go of the power button. Keep holding it until you see the startup options window. Click the gear “Options” icon and then click Continue.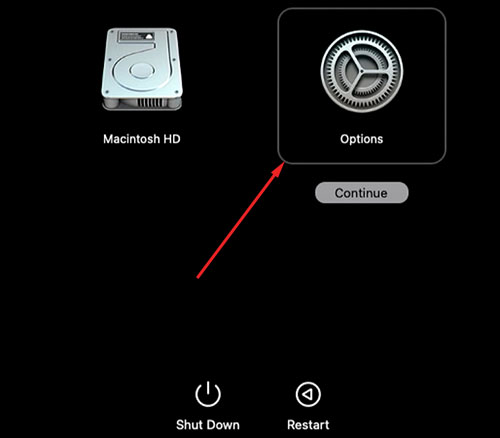
- You might be asked for your administrator password at this stage or a couple of steps later. Enter the password to proceed.
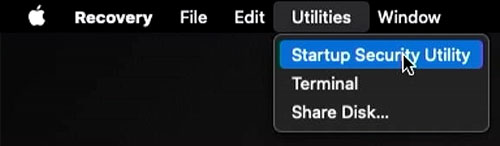
- Instead of using the utilities in the main window, go to the top menu bar, and select Utilities –> Startup Security Utility.
- Select the drive you are going to install the application on.
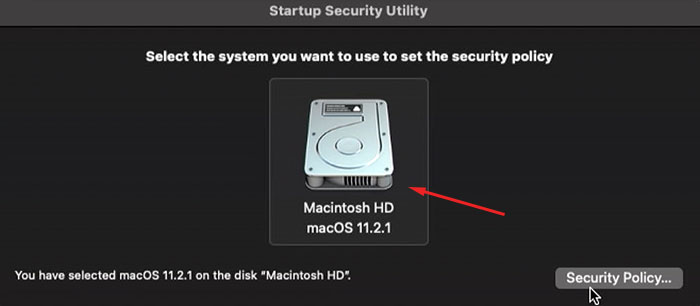
- In the window that opens select the “Reduced Security” option and tick the first “Allow user management of kernel extensions from identified developers” option.

- Click “OK” to save the settings and restart your computer in a regular mode.
- Now you can follow the steps listed for “T2 OR INTEL-BASED MACS” earlier in this article.
❓ What about Disk Drill for Windows?
Disk Drill for Windows makes SMART monitoring effortless—once you turn on the SMART feature, it automatically applies to all storage devices, including both internal and external drives. No extra configuration is needed for USB, Thunderbolt, or other removable disks: Disk Drill will immediately detect and display SMART health data for every connected drive, giving you a complete overview of your storage reliability.
How Do I Turn S.M.A.R.T. Monitoring OFF for External Devices in macOS?
To turn S.M.A.R.T. off for external devices you need to uninstall SAT SMART Driver. Here’s how to uninstall this additional module:
- On macOS 10.11+ – type the following commands (in Terminal.app):
sudo rm -r /Library/Extensions/SATSMARTDriver.kext
sudo rm -r /Library/Extensions/SATSMARTLib.plugin - If using macOS version older than 10.11, execute the following commands in Terminal:
sudo rm -r /System/Library/Extensions/SATSMARTDriver.kext
sudo rm -r /System/Library/Extensions/SATSMARTLib.plugin - After executing the commands, restart your Mac.
How to Enable Extended S.M.A.R.T. Monitoring in Disk Drill for Windows
By default, Disk Drill for Windows can’t read S.M.A.R.T. data from external RAID enclosures that use JMicron JMS56x or JMB39x controllers. These controllers power many USB-to-SATA RAID docks and drive enclosures, but their SMART attributes aren’t exposed through standard APIs. Enabling Disk Drill’s Extended S.M.A.R.T. option forces the app to query these controllers directly—so you can monitor health statistics and spot potential drive failures before they happen.
To turn on Extended S.M.A.R.T.:
- Open Disk Drill and navigate to Extra Tools → S.M.A.R.T. Monitoring.
- Toggle on “Show extended options inside” to enable the JMicron-specific queries.
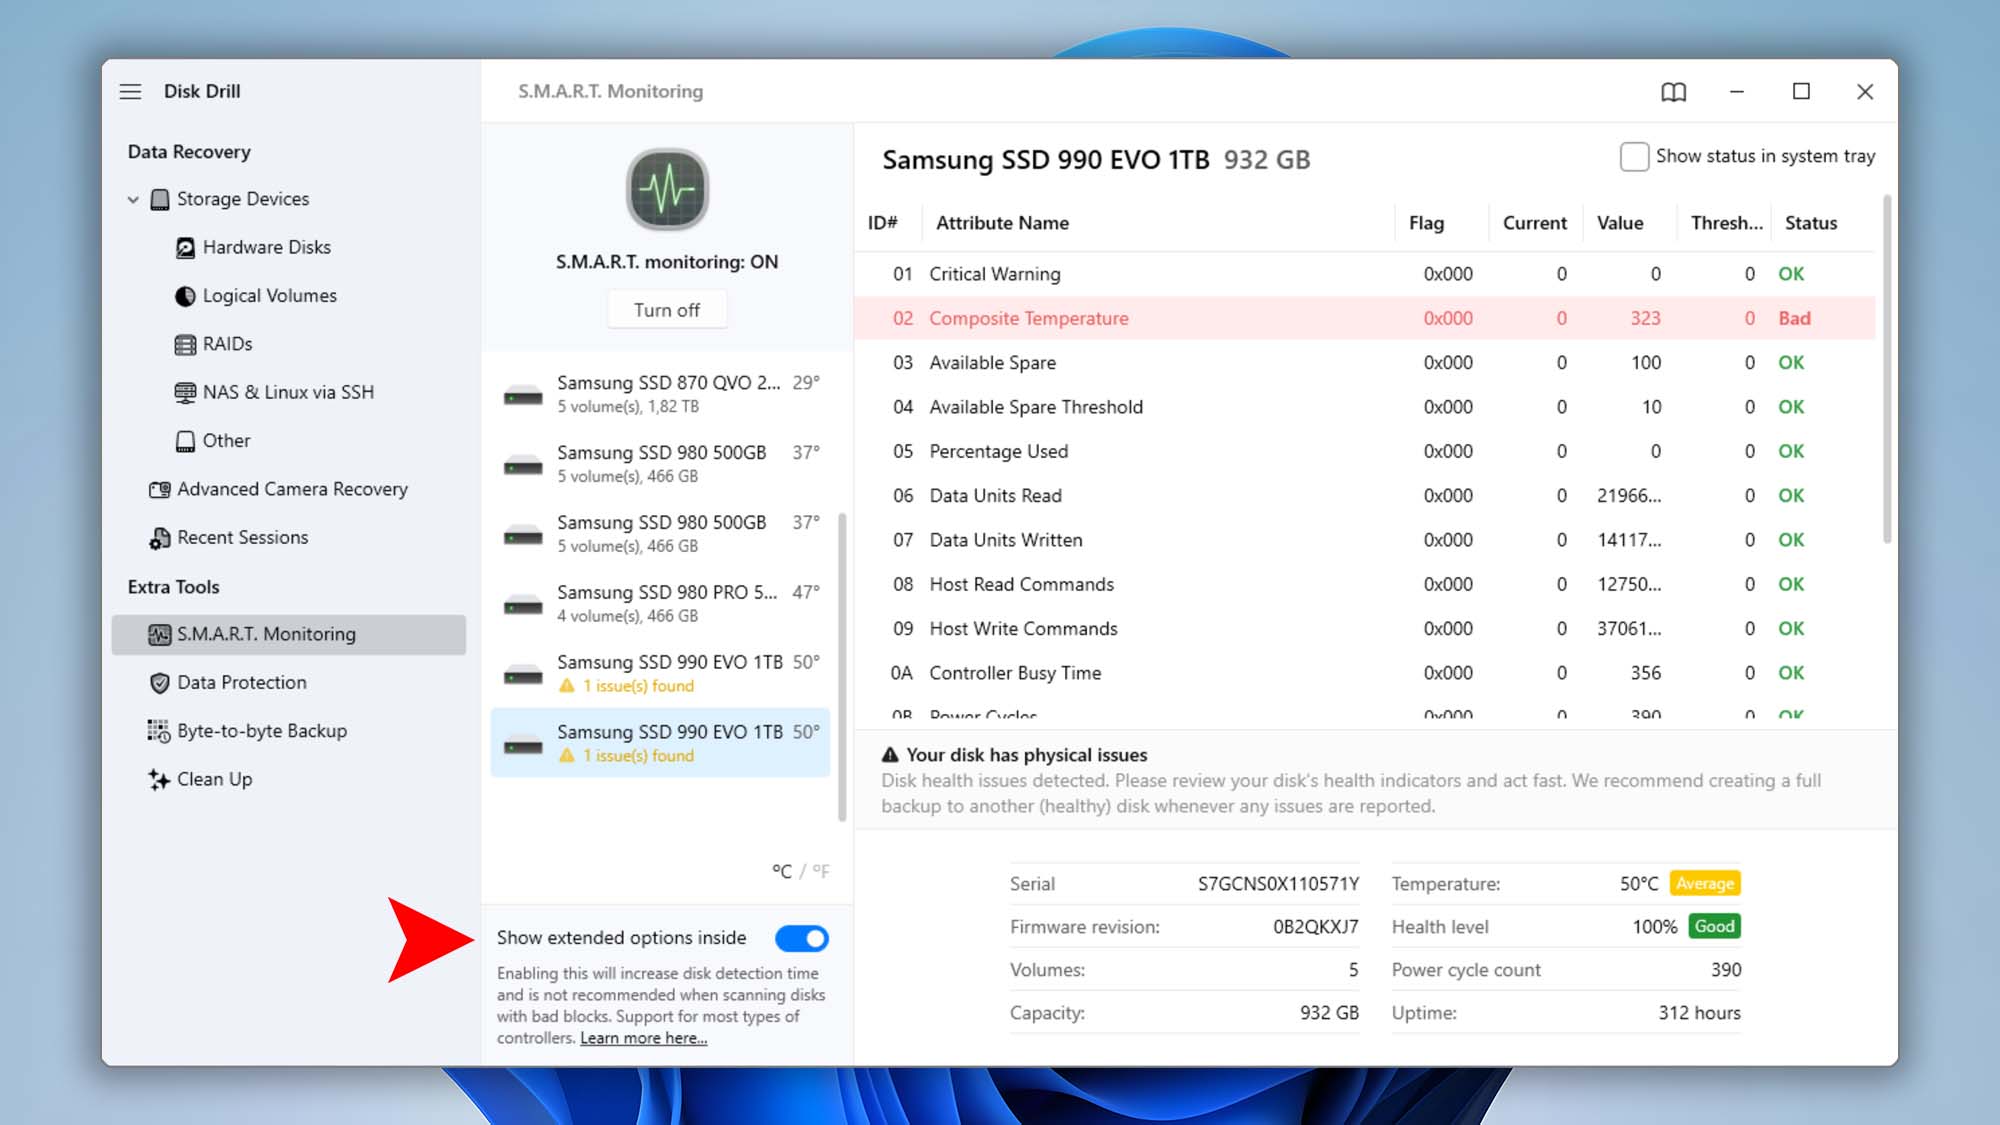
With Extended S.M.A.R.T. enabled, Disk Drill will regularly poll JMS56x/JMB39x–based enclosures for full SMART attributes, helping you maintain optimal disk health and prevent data loss.
How to Change Temperature Units in Disk Drill’s S.M.A.R.T. Monitoring
Disk Drill automatically detects your system’s regional settings and displays temperatures in the appropriate units (Celsius or Fahrenheit). To manually switch between °C and °F:
- Open Disk Drill and navigate to Extra Tools → S.M.A.R.T. Monitoring.
- At the bottom of the disk list, click °C or °F to toggle your preferred temperature unit.


How to Enable or Disable the S.M.A.R.T. Icon in macOS Menu Bar and Windows System Tray
🍏 Disk Drill for macOS
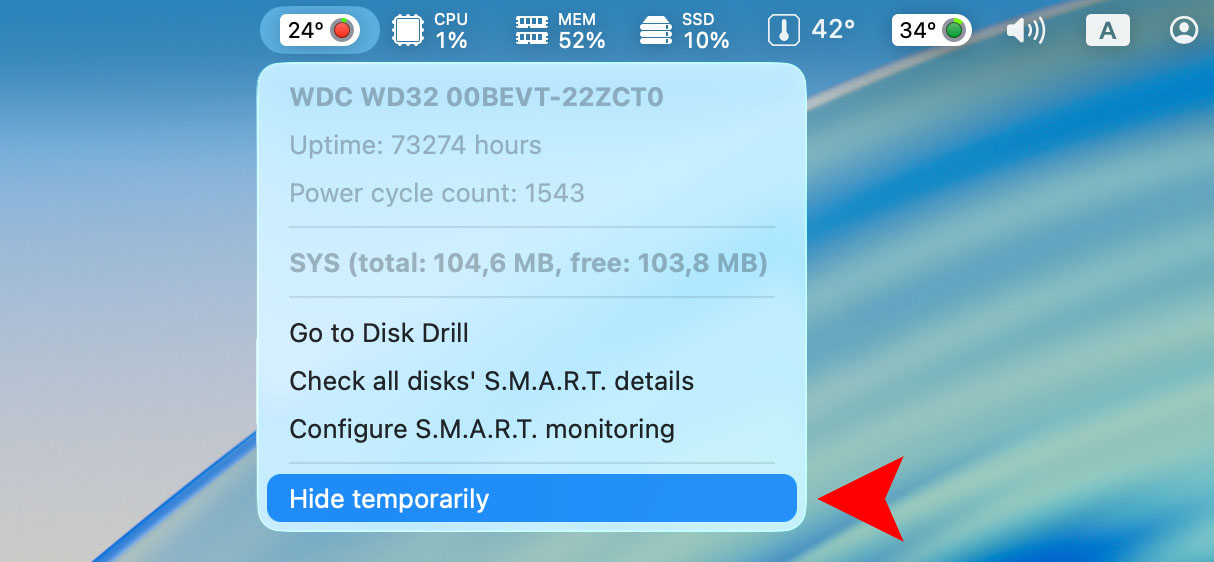
When enabled in Disk Drill, S.M.A.R.T. monitoring will add an icon to the top-right of your menu bar for easy access to information about your hard drive as well as S.M.A.R.T. settings. The default icon either looks like a small gear ⚙️ or a token 🚥 with temperature info and a light indicator, depending on the settings you choose in the app. To modify this:
- Click the S.M.A.R.T. icon in the menu bar and select “Go to Disk Drill“.

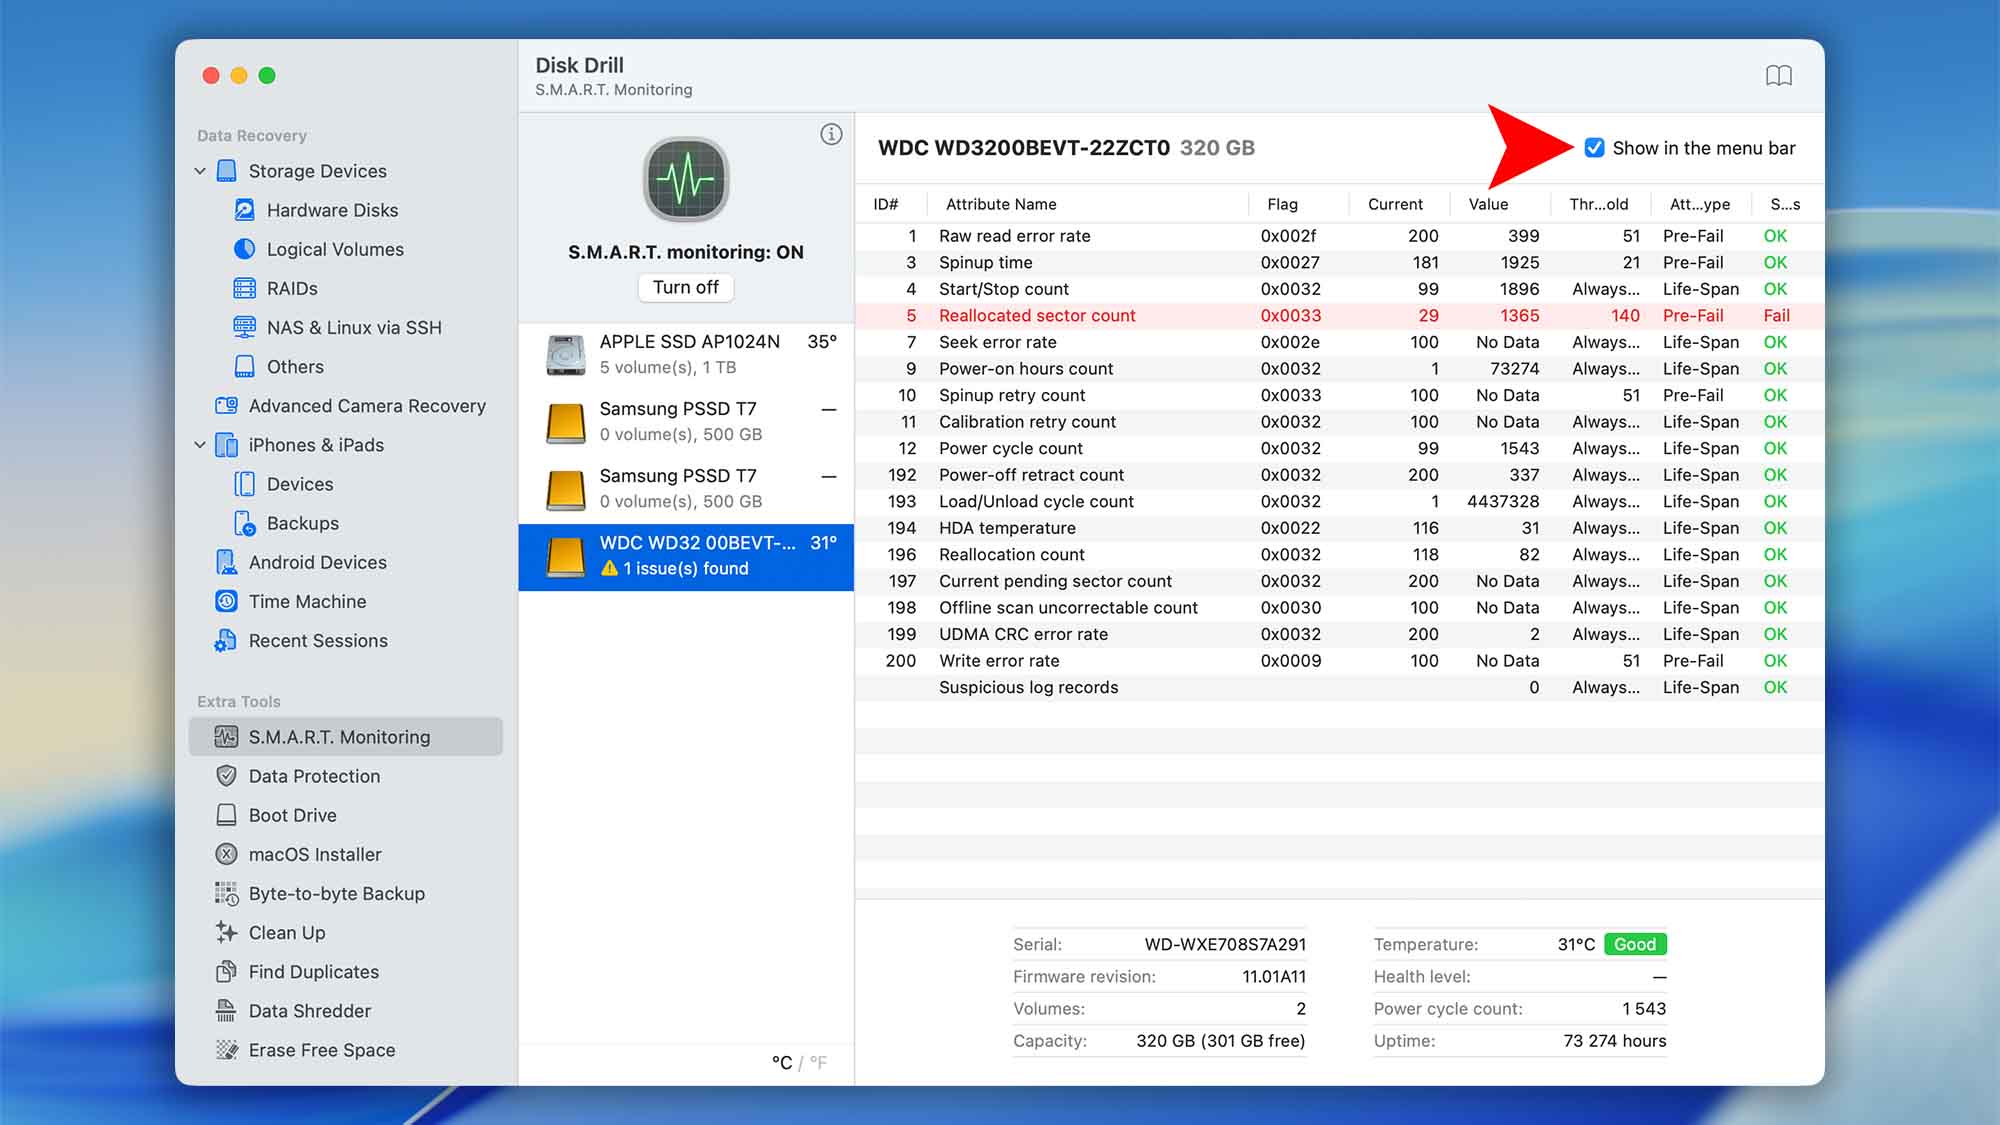
- Go to “Extra Tools” in the left panel of the app window and select S.M.A.R.T. monitoring.
- Select a drive and disable “Show in the menu bar” option to only keep the basic S.M.A.R.T. menu (looks like a gear in this case). Enabling it changes the gear icon to a temperature token and shows extended data about your disk’s health.
- To completely hide the S.M.A.R.T. icon from the menu bar, click it and use the “Hide temporarily” option. This will hide the icon from the menu bar until the next macOS restart.
🪟 Disk Drill for Windows
Unlike the macOS edition, Disk Drill for Windows only performs S.M.A.R.T. health checks while the app is running—there’s no background service. All S.M.A.R.T. settings apply exclusively to the live application:
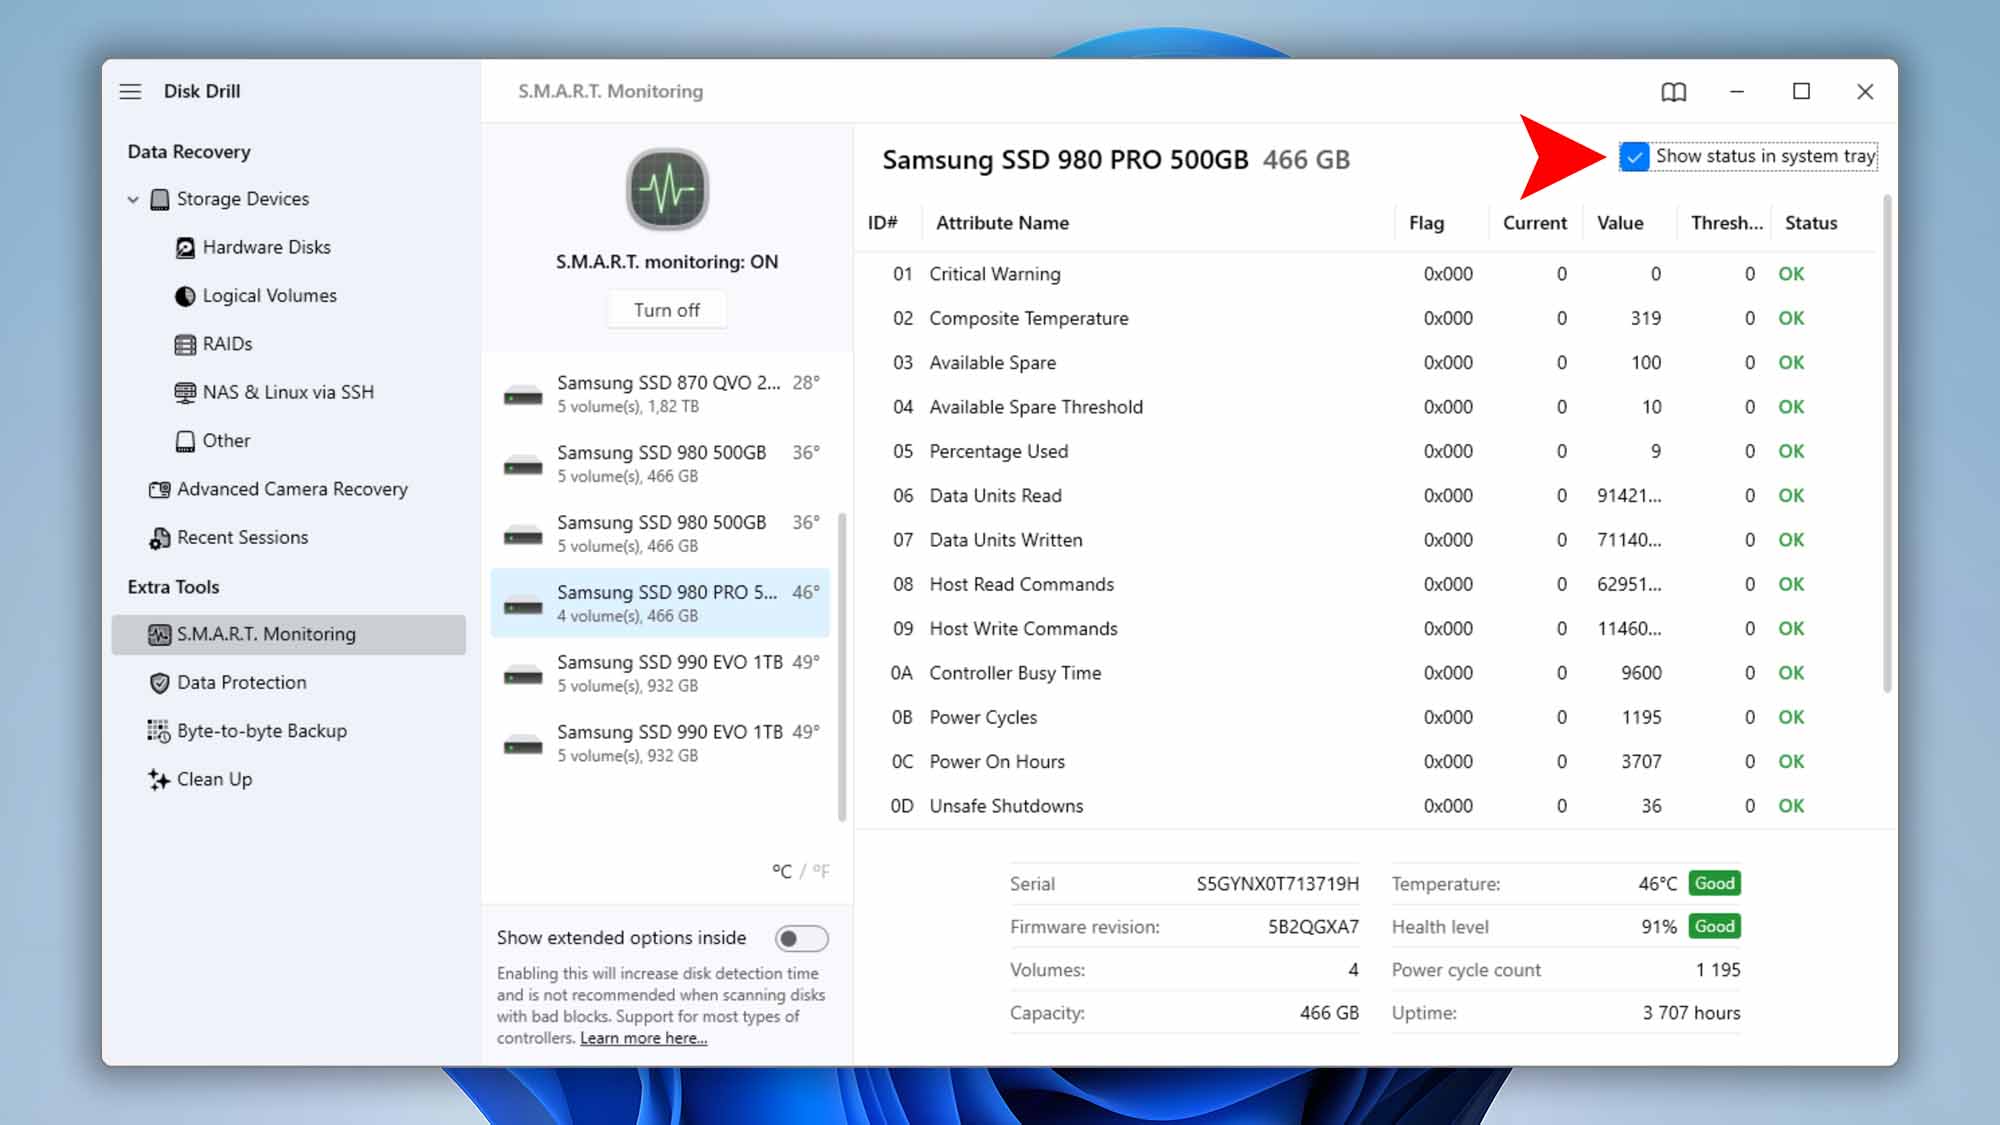
- Open Disk Drill and go to Extra Tools → S.M.A.R.T. Monitoring.
- In the top-right corner of the SMART Monitoring window, toggle “Show status in system tray” on or off depending on your preference.
- Click the Disk Drill icon in the system tray to view basic disk health information at a glance.
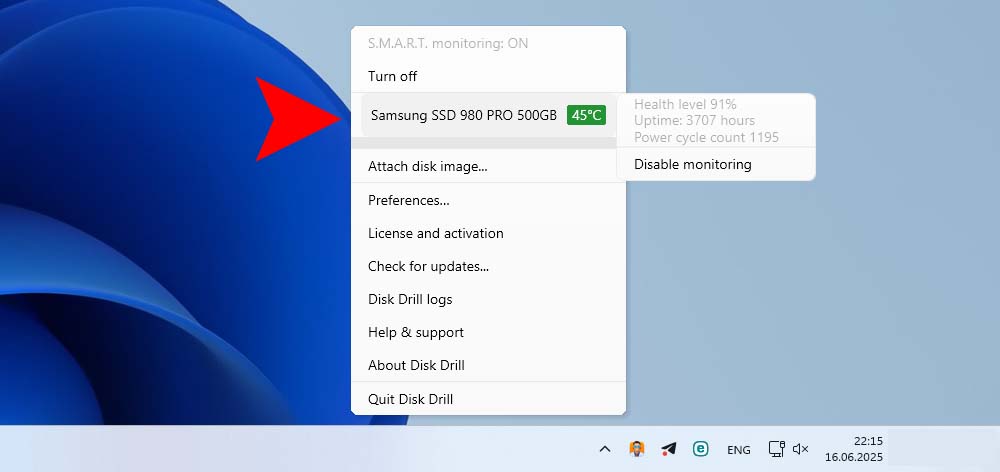
- Alternately, disable health monitoring for any drive by opening the system tray menu, hovering over the desired disk, and selecting “Disable monitoring“.
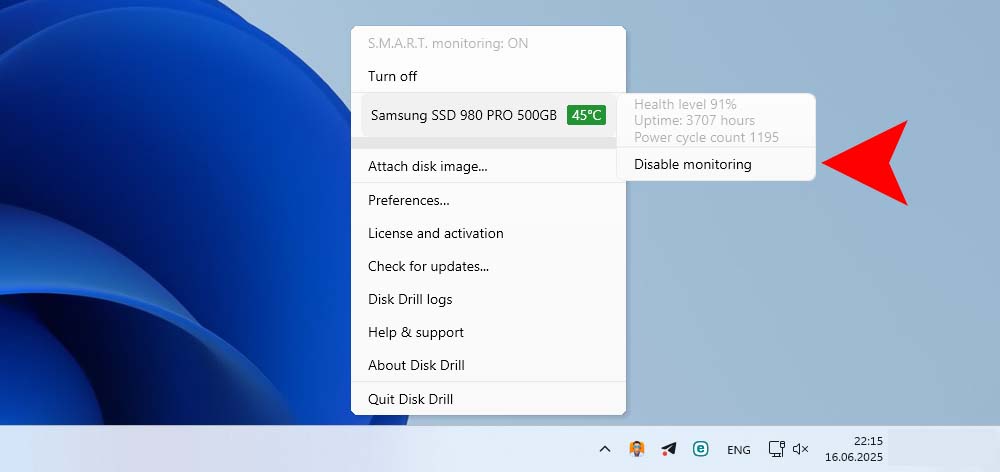
With these two simple steps, you can control whether Disk Drill displays your drives’ S.M.A.R.T. health icons in the Windows system tray.
How Do I View the S.M.A.R.T. Status Information
Way #1: From the Disk Drill Interface
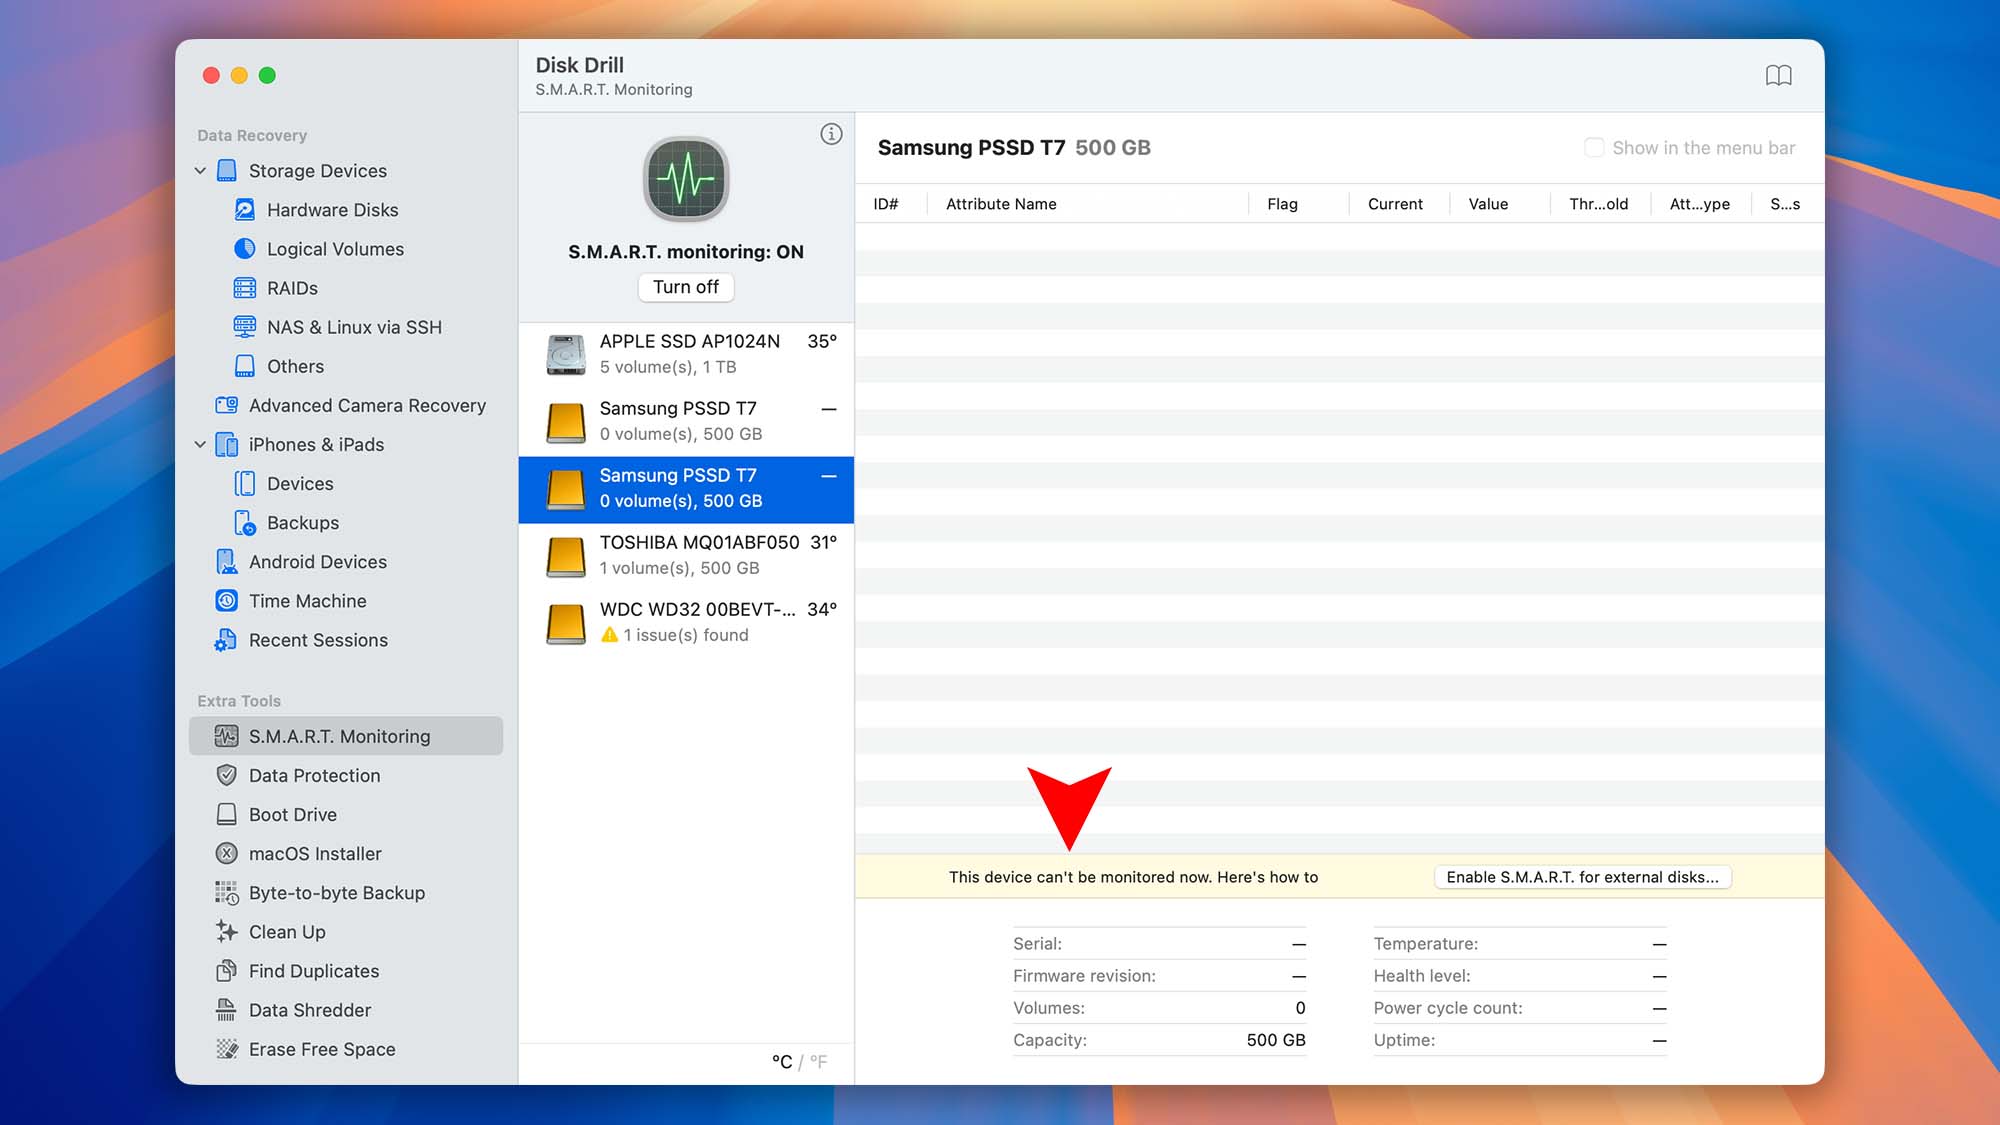
To stay on top of your drive’s health, Disk Drill provides a built-in S.M.A.R.T. monitoring dashboard. Here’s how to review every SMART attribute and catch potential failures early:
- Launch Disk Drill and select Extra Tools in the main window.
- Click S.M.A.R.T. Monitoring to open the health dashboard.
- In the list of connected drives, click a disk’s name to expand its full S.M.A.R.T. table.
- Review individual attributes—temperature, reallocated sectors, wear leveling count, and more—to gauge overall drive health.
- If Disk Drill detects a critical issue, you’ll see a red alert icon next to the drive along with a clear error message and description.


By regularly checking S.M.A.R.T. data in Disk Drill, you can spot early warning signs—like increasing bad sectors or temperature spikes—before they lead to data loss.
Fast-Track Access to Problematic Drives’ S.M.A.R.T. Data
Disk Drill also gives you a one-click way to zero in on drives that need attention. In the Storage Devices list, any disk with a detected health issue is highlighted in red and marked with a ❗ icon. Simply click that icon to jump straight to the S.M.A.R.T. parameters for that drive—no need to sift through healthy disks. This streamlined workflow helps you prioritize drive checks and address critical alerts before they turn into data loss disasters.


Way #2: Monitor Drive Health from the S.M.A.R.T. Icon in Your Menu Bar or System Tray
Disk Drill adds a small S.M.A.R.T. status indicator to your macOS menu bar or Windows system tray, so you can check drive health at a glance:


- 🔴 Red or 🟡 Yellow means that S.M.A.R.T. is active, however bad sectors or other S.M.A.R.T. issues have been detected.
- 🟢 Green also means that S.M.A.R.T. is active and it hasn’t detected any problems.
Click the icon to open Disk Drill’s health dashboard and review S.M.A.R.T. attributes. This always-on, color-coded alert system ensures you catch potential SSD or HDD failures before they lead to data loss.
S.M.A.R.T. (Self-Monitoring, Analysis, and Reporting Technology) Explained
Most S.M.A.R.T. attributes are standardized across drive manufacturers, so whether you’re using a Seagate HDD, a Samsung SSD, or another brand, you can reliably read key metrics like temperature and total power-on hours. Your drive’s firmware constantly polls onboard sensors, processes the raw readings through manufacturer-specific algorithms, and updates each S.M.A.R.T. attribute accordingly.
A typical S.M.A.R.T. attribute record includes:
- Current (6 bytes). The unprocessed sensor or counter output. Depending on the attribute, these 48 bits may be split into low, mid, and high segments to track different data types—such as error counts, temperature, or run-out cancellations.
- Value (1 byte). A manufacturer-defined “health score,” usually starting near a maximum (e.g., 100, 200, or 253) on a new drive and decreasing as wear or errors accumulate.
- Threshold (1 byte). The failure limit. When the normalized health value drops below this threshold, the firmware flags the attribute as critical.
- Status. Indicators that classify each attribute as either: Pre-failure (predictive of imminent hardware failure), Statistical (tracking long-term wear but not directly predictive) and OK.
A S.M.A.R.T. attribute is considered healthy when its normalized Value meets or exceeds its Threshold. If a critical attribute’s value drops below its threshold, the drive is flagged as failing and should be replaced immediately—this attribute pinpoints the specific issue. Under most warranties, manufacturers will replace a failing hard drive. Modern BIOS implementations use S.M.A.R.T. to warn you of impending drive failure before your operating system even boots.
Key ATA S.M.A.R.T. Attributes
Below is a list of commonly supported ATA S.M.A.R.T. attributes. Higher normalized values typically indicate better drive health (except for temperature and load/unload cycles, where lower is better). Use this table to interpret the metrics shown by Disk Drill`s monitoring tool.
- ID – attribute code in both decimal and hexadecimal notation (for example, 1 / 0x01).
- Attribute Name – the standardized name of the SMART parameter.
- Ideal – indicates whether a higher or lower raw value reflects better drive health:
- High – higher value is better
- Low – higher value is better
- Description – a concise summary of what the parameter measures.
| ID (Dec / Hex) |
Attribute Name | Ideal | Description |
|---|---|---|---|
| 1 / 0x01 | Read Error Rate | Low | Tracks hardware read errors before ECC; raw value varies by vendor. |
| 2 / 0x02 | Throughput Performance | High | Overall read/write transfer performance; drops signal a problem. |
| 3 / 0x03 | Spin-Up Time | Low | Time (ms) to reach full spindle speed. |
| 4 / 0x04 | Start/Stop Count | — | Number of power-on/spin-off cycles. |
| 5 / 0x05 | Reallocated Sectors Count | Low | Count of bad sectors remapped to spare area. |
| 6 / 0x06 | Read Channel Margin | — | Signal margin in the read channel; vendor-specific. |
| 7 / 0x07 | Seek Error Rate | — | Rate of head positioning errors; vendor-specific. |
| 8 / 0x08 | Seek Time Performance | High | Average head seek speed; declines indicate wear. |
| 9 / 0x09 | Power-On Hours | — | Total hours powered on; gauge for drive lifespan. |
| 10 / 0x0A | Spin Retry Count | Low | Times the drive retried spinning up; non-zero flags motor issues. |
| 11 / 0x0B | Recalibration Retry Count | Low | Head recalibration retries; increasing count indicates mechanical faults. |
| 12 / 0x0C | Power Cycle Count | — | Number of full power-off/on cycles. |
| 13 / 0x0D | Soft Read Error Rate | Low | Recoverable read errors corrected by firmware. |
| 22 / 0x16 | Current Helium Level | High | Helium concentration in HGST He8 drives. |
| 23 / 0x17 | Helium Condition Lower | — | Toshiba MG07+ helium lower threshold. |
| 24 / 0x18 | Helium Condition Upper | — | Toshiba MG07+ helium upper threshold. |
| 170 / 0xAA | Available Reserved Space | — | Status of reserved spare pool. |
| 171 / 0xAB | SSD Program Fail Count | — | Total flash program failures (Kingston). |
| 172 / 0xAC | SSD Erase Fail Count | — | Flash erase failures count (Kingston). |
| 173 / 0xAD | SSD Wear Leveling Count | — | Max erase count on any block. |
| 174 / 0xAE | Unexpected Power Loss Count | — | Unclean shutdowns count on SSD. |
| 175 / 0xAF | Power Loss Protection Failure | — | Capacitor discharge test results. |
| 176 / 0xB0 | Erase Fail Count | — | Flash erase command failures. |
| 177 / 0xB1 | Wear Range Delta | — | Difference between most and least worn blocks. |
| 178 / 0xB2 | Used Reserved Block Count | — | Samsung pre-fail reserved blocks used. |
| 179 / 0xB3 | Used Reserved Block Count Total | — | Cumulative reserved blocks used (Samsung). |
| 180 / 0xB4 | Unused Reserved Block Count Total | — | Remaining reserved blocks; zero may lock device. |
| 181 / 0xB5 | Program Fail Count Total | Low | Flash program failures since deployment. |
| 182 / 0xB6 | Erase Fail Count | — | Samsung-specific erase failures. |
| 183 / 0xB7 | SATA Downshift Error Count | Low | Link speed downshifts or runtime bad blocks. |
| 184 / 0xB8 | End-to-End Error | Low | IO data path parity failures. |
| 185 / 0xB9 | Head Stability | — | WD-specific head stability metric. |
| 186 / 0xBA | Induced Op-Vibration Detection | — | WD vibration detection metric. |
| 187 / 0xBB | Reported Uncorrectable Errors | Low | Errors not recoverable by ECC. |
| 188 / 0xBC | Command Timeout | Low | Operations aborted due to timeout. |
| 189 / 0xBD | High Fly Writes | Low | Unsafe head fly-height detected. |
| 190 / 0xBE | Temperature Difference / Airflow Temperature | Varies | Difference between current temp and 100 °C. |
| 191 / 0xBF | G-Sense Error Rate | Low | Shock/vibration-induced errors count. |
| 192 / 0xC0 | Power-Off Retract Count | Low | Emergency head parks on power loss. |
| 193 / 0xC1 | Load/Unload Cycle Count | Low | Head parking/unparking cycles. |
| 194 / 0xC2 | Temperature Celsius | Low | Current drive temperature in °C. |
| 195 / 0xC3 | Hardware ECC Recovered | Varies | Errors corrected by ECC engine. |
| 196 / 0xC4 | Reallocation Event Count | Low | Attempts to remap bad sectors. |
| 197 / 0xC5 | Current Pending Sector Count | Low | Unstable sectors awaiting remap. |
| 198 / 0xC6 | Offline Uncorrectable Sector Count | Low | Uncorrectable errors found offline. |
| 199 / 0xC7 | UDMA CRC Error Count | Low | Interface cable data errors. |
| 200 / 0xC8 | Multi-Zone Error Rate | Low | Errors across recording zones. |
| 201 / 0xC9 | Soft Read Error Rate | Low | Recoverable software read errors. |
| 202 / 0xCA | Data Address Mark Errors | Low | Missing or misplaced data address marks. |
| 203 / 0xCB | Run-Out Cancel | Low | Checksum errors during correction. |
| 204 / 0xCC | Soft ECC Correction | Low | Errors corrected by internal ECC. |
| 205 / 0xCD | Thermal Asperity Rate | Low | Errors caused by temperature spikes. |
| 206 / 0xCE | Flying Height | — | Head-to-media clearance measurement. |
| 207 / 0xCF | Spin High Current | Low | Surge current to spin up. |
| 208 / 0xD0 | Spin Buzz | — | Buzz events count on spin up. |
| 209 / 0xD1 | Offline Seek Performance | — | Drive’s internal seek test performance. |
| 210 / 0xD2 | Vibration During Write | — | Vibration events during write operations. |
| 211 / 0xD3 | Shock During Write | — | Recorded shock events during writes. |
| 220 / 0xDC | Disk Shift | Low | Distance disk shifted on spindle. |
| 221 / 0xDD | G-Sense Error Rate | Low | Duplicate shock/vibration error metric. |
| 222 / 0xDE | Loaded Hours | — | Time operating under load. |
| 223 / 0xDF | Load/Unload Retry Count | — | Failed head load/unload attempts. |
| 224 / 0xE0 | Load Friction | Low | Mechanical friction during operation. |
| 225 / 0xE1 | Load/Unload Cycle Count | Low | Total head load/unload cycles. |
| 226 / 0xE2 | Load-In Time | — | Time to load heads from ramp. |
| 227 / 0xE3 | Torque Amplification Count | Low | Compensations for platter speed variations. |
| 228 / 0xE4 | Power-Off Retract Cycle | Low | Retract events on power-off or sleep. |
| 230 / 0xE6 | Drive Life Protection Status | — | SSD life status or GMR head amplitude. |
| 231 / 0xE7 | Life Left | — | Approximate SSD life remaining. |
| 232 / 0xE8 | Endurance Remaining | — | Percent of erase cycles used or spare pool status. |
| 233 / 0xE9 | Media Wearout Indicator | High | SSD normalized life indicator (100→1). |
| 234 / 0xEA | Average & Maximum Erase Count | — | Average and max block erase counts. |
| 235 / 0xEB | Good Block Count | — | Counts of good and free blocks. |
| 240 / 0xF0 | Head Flying Hours | — | Time positioning heads over media. |
| 241 / 0xF1 | Total LBAs Written | — | Logical blocks written by the host. |
| 242 / 0xF2 | Total LBAs Read | — | Logical blocks read by the host. |
| 243 / 0xF3 | Total LBAs Written (High) | — | Upper bytes of total LBAs written. |
| 244 / 0xF4 | Total LBAs Read (High) | — | Upper bytes of total LBAs read. |
| 245 / 0xF5 | Remaining Rated Write Endurance | High | Dell-certified SSD write endurance. |
| 246 / 0xF6 | Cumulative Host Sectors Written | — | Host-requested LBA writes (Micron). |
| 247 / 0xF7 | Host Program Page Count | — | NAND pages written by host (Micron). |
| 248 / 0xF8 | Background Program Page Count | — | NAND pages written by garbage collection. |
| 249 / 0xF9 | NAND Writes (1 GiB) | — | Total NAND writes in GiB increments. |
| 250 / 0xFA | Read Error Retry Rate | Low | Count of read retries on errors. |
| 251 / 0xFB | Minimum Spares Remaining | — | Percent of spare blocks left. |
| 252 / 0xFC | Newly Added Bad Flash Block | — | Count of newly detected bad flash blocks. |
Key NVMe S.M.A.R.T. Attributes
NVMe drives implement S.M.A.R.T. through a set of standardized attributes that report critical health and usage metrics. Below is the complete list of known NVMe S.M.A.R.T. attributes, including their byte offsets, data lengths, names, and clear descriptions to help you monitor and analyze your drive’s condition.
| Offset (Dec / Hex) |
Length (bytes) | Attribute Name | Description |
|---|---|---|---|
| 0 / 0x00 | 1 | Critical Warning | Flags critical drive conditions:
|
| 1 / 0x01 | 2 | Composite Temperature | Current controller and namespace temperature in kelvins. |
| 3 / 0x03 | 1 | Available Spare | Percentage of spare blocks remaining for bad-block remapping. |
| 4 / 0x04 | 1 | Available Spare Threshold | Minimum spare block percentage before triggering a warning. |
| 5 / 0x05 | 1 | Percentage Used | Estimated percentage of the drive’s program/erase cycles consumed. |
| 32 / 0x20 | 16 | Data Units Read | Total 512-byte data units read by the host, reported in thousands. |
| 48 / 0x30 | 16 | Data Units Written | Total 512-byte data units written by the host, reported in thousands. |
| 64 / 0x40 | 16 | Host Read Commands | Count of NVMe Read commands completed by the controller. |
| 80 / 0x50 | 16 | Host Write Commands | Count of NVMe Write commands completed by the controller. |
| 96 / 0x60 | 16 | Controller Busy Time | Cumulative time the controller spent processing I/O commands (in milliseconds). |
| 112 / 0x70 | 16 | Power Cycles | Number of times the drive has been power-cycled. |
| 128 / 0x80 | 16 | Power On Hours | Total hours the drive has been powered on (excluding low-power states). |
| 144 / 0x90 | 16 | Unsafe Shutdowns | Count of unexpected power losses without a shutdown notification. |
| 160 / 0xA0 | 16 | Media Errors | Number of unrecovered data integrity errors (ECC failures, CRC mismatches, LBA mismatches). |
| 176 / 0xB0 | 16 | Error Information Log Entries | Total entries logged in the controller’s error information log. |
| 192 / 0xC0 | 4 | Warning Composite Temperature Time | Minutes the drive spent above the warning temperature threshold but below the critical limit. |
How S.M.A.R.T. Monitoring Impacts Your Drives and Disk Drill Scans
Enabling S.M.A.R.T. monitoring in Disk Drill has zero impact on your system performance or resource usage. It won’t slow down your scans, and it runs so efficiently that you can spot drive issues—like rising bad-sector counts or overheating—long before they lead to data loss.
Disk Drill’s S.M.A.R.T. monitoring updates disk information regularly:
- in menu bar (macOS) – once every 2️⃣ minutes;
- in system tray (Windows) – once every 5️⃣ minutes;
- In Disk Drill disk list – once every 5️⃣ minutes.
If you do choose to monitor internal drives, we recommend keeping S.M.A.R.T. turned off whenever you connect potentially problematic external disks. That way, you avoid unnecessary polling of unstable drives and can focus Disk Drill’s health checks where they matter most. When you’re done working with those externals, simply re-enable S.M.A.R.T. monitoring to resume proactive disk health tracking.
What Mechanism Does Disk Drill for macOS Use to Integrate With S.M.A.R.T.
Disk Drill for macOS works with Smartmontools – a library that can control and monitor storage systems using SMART technology. Source code tarballs and precompiled packages of Smartmontools for Darwin (macOS) are available here. Disk Drill users on macOS can change the default package of smartmontools whenever they need to do so – this allows using any custom-compiled or any other version of the tool.
To choose which version of Smartmontools package you want Disk Drill for macOS to use, follow these steps:
- Download the required precompiled package of Smartmontools.
- Mount the downloaded .dmg file and install the .pkg file from it.
- By default the smartmontools package is installed to:
➡️ For newer macOS versions – /usr/local/sbin/
➡️ For older mac OS X versions – /usr/local/bin/ - Copy the path to the smartctl executable from step 3 (a or b). You’ll need it in step 6. An example of how the path looks like: /usr/local/sbin/smartctl
- Open Terminal.
- Execute the following command:
defaults write com.cleverfiles.DiskDrill SmartmontoolsPath "PATH_TO_EXECUTABLE_FROM_STEP_3"
What Do the Suspicious Log Records Mean (macOS)?
Disk Drill previously detected certain disk errors by scanning macOS system logs for your internal disk. This legacy “Suspicious Log Records” check is now deprecated in Disk Drill and is not supported for system drives (your Mac’s internal/boot drive). On modern versions of macOS, this approach is no longer effective because Apple changed how system logging works and tightened system protections on the boot volume.
Why this feature was deprecated (and why it’s not needed anymore)
- The old method relied on legacy Apple System Log (ASL) files (the same approach described in the original article, including clearing /var/log/asl/*).
- macOS moved away from ASL to the Unified Logging system (introduced around macOS 10.12), which stores logs differently and makes “read a folder of log files and look for patterns” a much less reliable strategy than it used to be.
- Disk Drill already provides a better replacement: S.M.A.R.T. Monitoring, which reads drive health indicators directly and can alert you when a drive is likely to fail—without depending on legacy log formats.
Practical takeaway
The old “suspicious logs” workflow was basically an indirect signal (“something in logs looks worrying”). Modern Disk Drill guidance is to use direct health telemetry (S.M.A.R.T.) plus backups—more accurate, fewer false alarms, and compatible with current macOS security/logging behavior.